Metrel PQA: New release of PowerView3.0 and firmware for all the Metrel PQAs
|
|
Firmware: Implementation of current inversion function (per phase)
- Installing current clamps can be hard, particularly in the cramped confines of your average switchboard, and changing their orientation can be an onerous task. However, if the current clamps were initially installed the wrong way (wrong current clamp orientation – wrong direction), this can be now remedied by inverting the current direction on the analyser – without physically touching the clamps.
|
|
 |
|
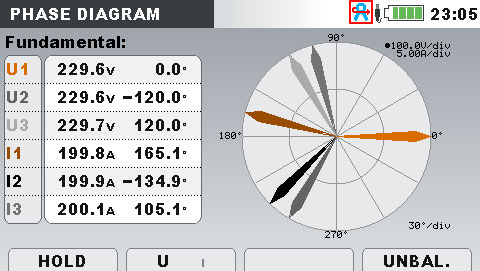
Image 1: Phase diagram (current on phase L1 points in the wrong direction).
|
 |
|
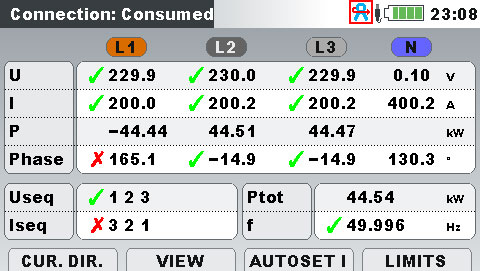
Image 2: Inverting current on phase L1.
|
 |
|
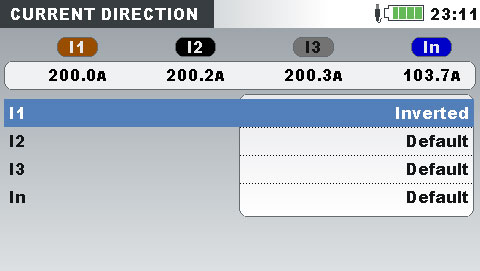
Image 3: Indication of inverted current.
|
|
This function is available on MI 2893 Power Master XT/MI 2892 Power Master/MI 2885 Master Q4 from HW9.0 onward and on MI 2884 Energy Master XA/MI 2883 Energy Master.
|
|
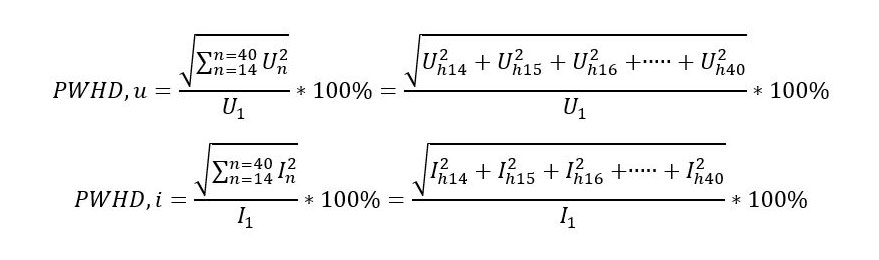
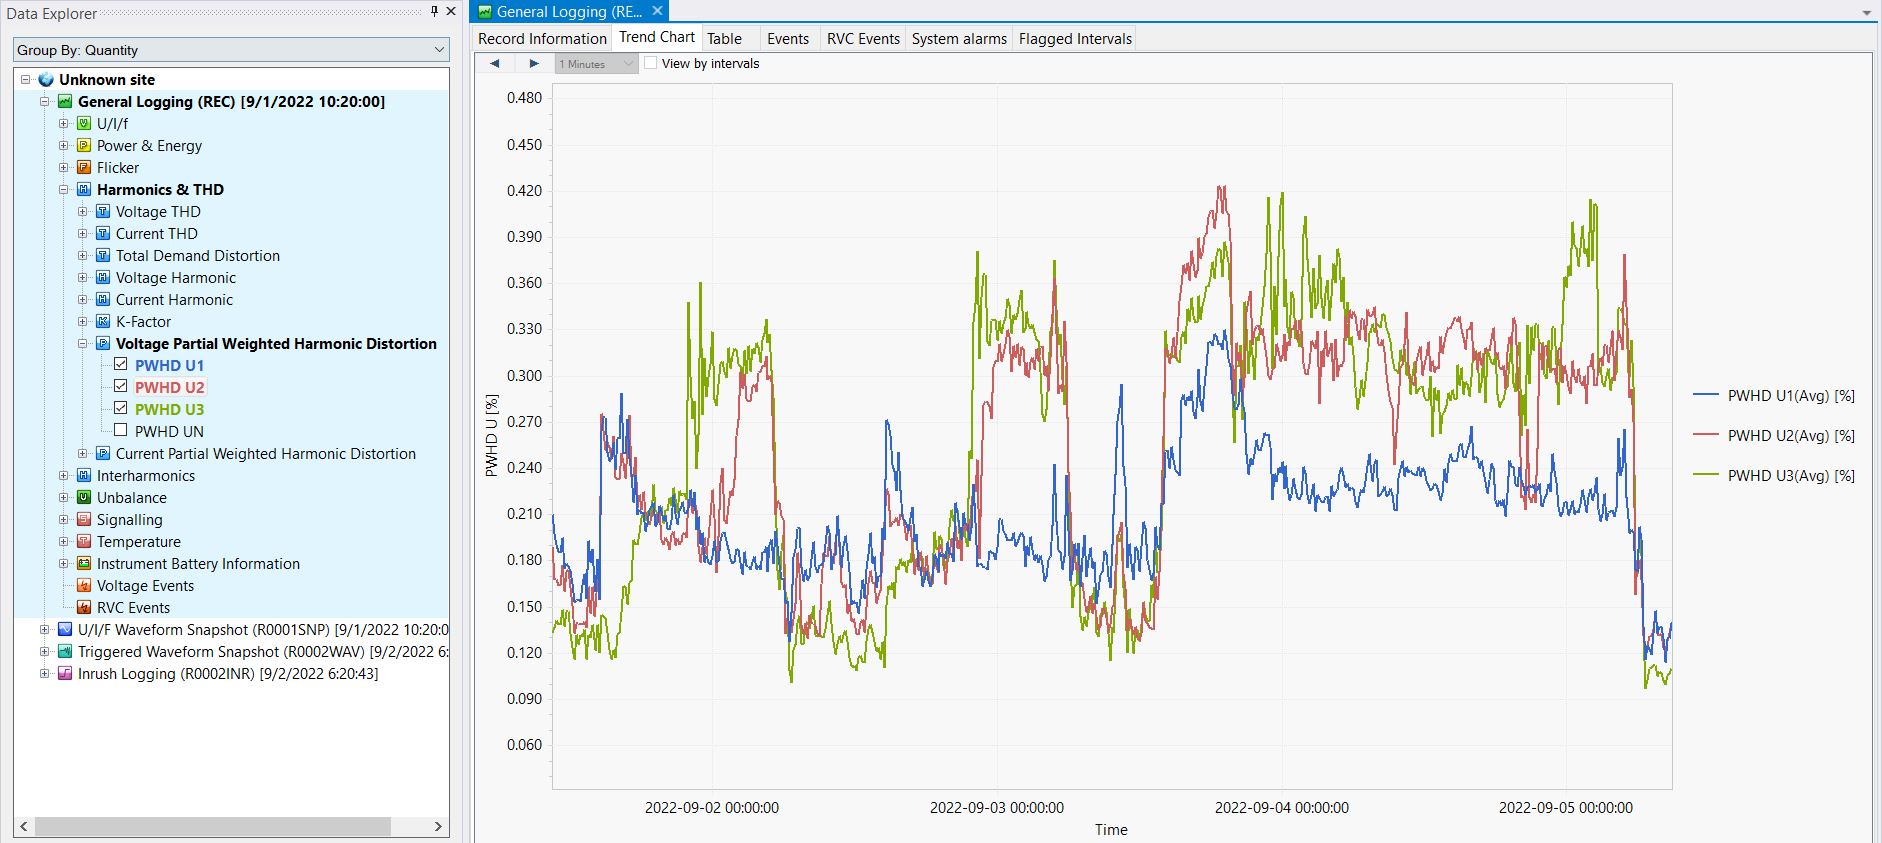
Software: Partial Weighted Harmonic Distortion – PWHD
- Partial Weighted Harmonic Distortion (PWHD) is the ratio of the rms value of a selected group of higher order harmonics (default setup in PowerView3.0 starting from the 14th harmonic order up to 40th harmonic order, to the rms value of the fundamental). The PWHD puts more emphasis on high harmonics in comparison with THD and is mostly used in evaluation of capacitive loads (e.g., LCL filters).
|
|
| Image 4: PWHD is calculated according to the following formula. |
|
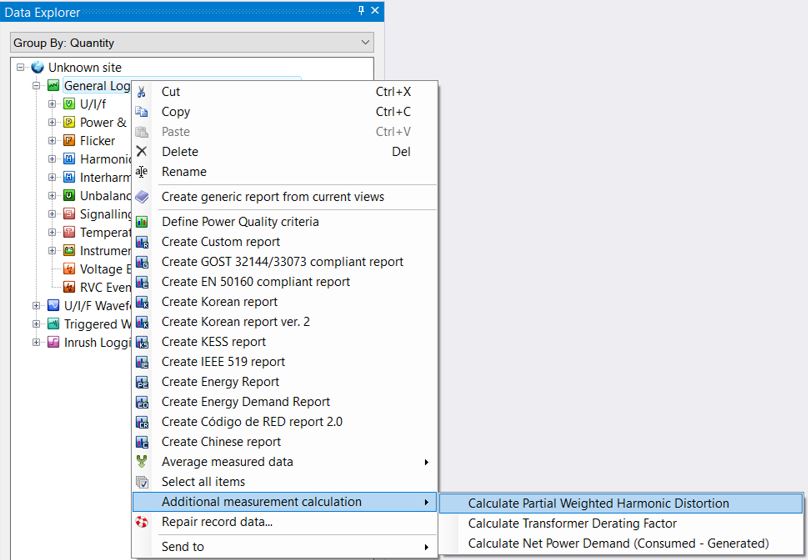
Image 5: Select General Logging and press the right mouse button and select Partial Weighted Harmonic Distortion.
|
|
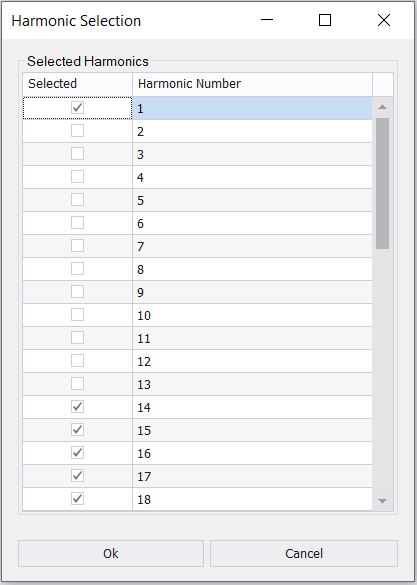
Image 6: Select “Partial Weighted Harmonic Distortion” and select harmonics component that you want to be included in the PWHD presentation.
|
|
Image 7: Partial Weighted Harmonic Distortion data is presented under “Harmonics & THD” results.
|
|
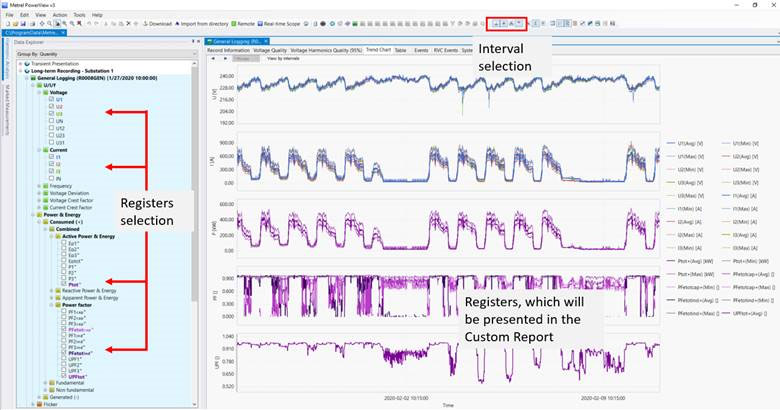
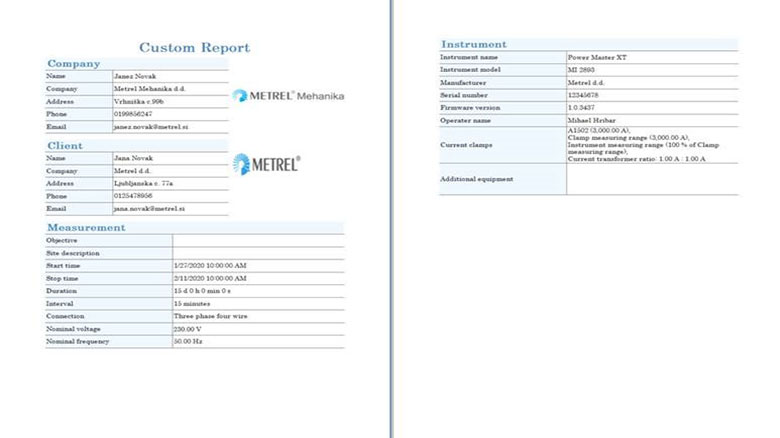
Software: Custom report
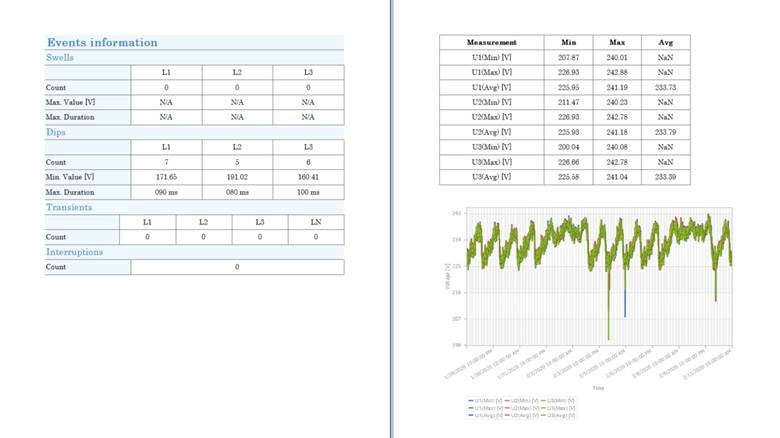
- Custom report is automatically created from the registers, which are selected in the Trend Chart. Group of values related to the same quantity is presented in one chart. Interval values (Avg, AvgOn, Max, Min), which are selected in the chart, are also presented in the report. For each MIN – AVG – MAX value, the selected interval is presented. Additionally, number of Dip/Swell/Interruption and Transients are presented in the specific table. Report can be equipped with Client and Company information.
|
|
Image 8: Select registers and intervals that you want to present in the report.
|
|
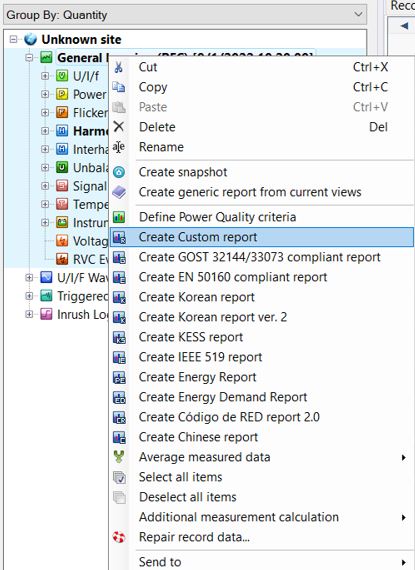
Image 9: Select Custom report from the drop-down list.
|
|
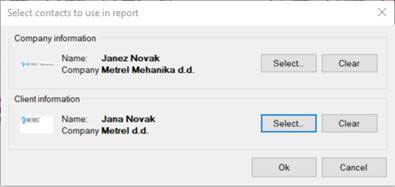
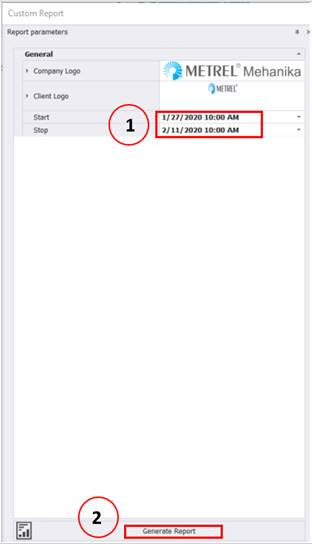
Image 10: Select Company and Client information if needed.
|
|
Image 11: Select Time interval, which should be included in the report and press Generate Report.
|
|
Reports can be saved in various formats, including: .doc, .pdf, .rtf, .txt, .xml…
|
|
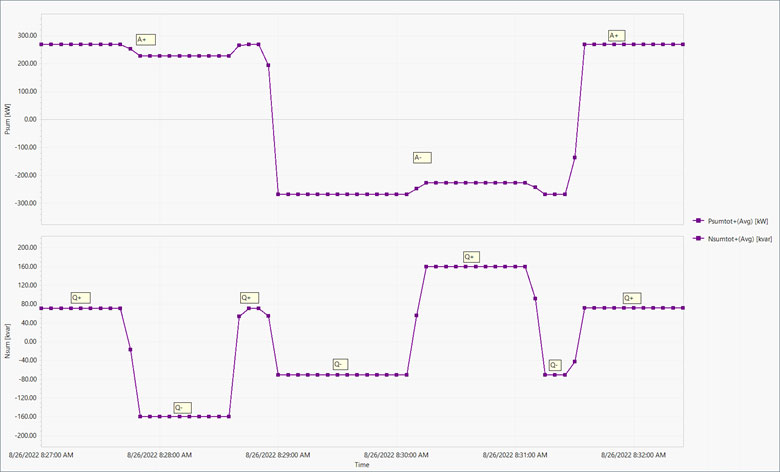
Software: Net presented Power registers (Consumed – Generated)
- For some locations, like wind turbines, photovoltaic installations, or measurement locations, where consumed and generated energy is expected, it is sometimes desired to present demand as “unique” value in the same chart, where consumed demand is presented with the positive (+) sign and generated demand with the negative sign (-). Both demands are Net presented; active and reactive.
|
|
Image 14: Calculation algorithms are Psumtot = Ptot+ - Ptot- and Nsumtot = (Ntotind+ + Ntotcap+) – (Ntotind- + Ntotcap-).
|
|
Metrel d.d.
| Ljubljanska c. 77 | | SI-1354 Horjul | | Slovenia |
|
|
|
|