Power quality reports
Low voltage power quality
It may be desirable to formalise the reporting of the quality of the power supply and energy rating of a building, but the first priority is: do the instruments perform the required measurements?
The initial report follows the standard EN 50160. It mainly covers general voltage characteristics over time. The general recorder is set to periods of 10 minutes over at least 7 days. This measurement ought be performed after installing any new large loads to test for any energy pollution they might cause on the grid. The general recorder saves about 4000 parameters and values of the electrical network, processed from voltage and current measurements. They are then interpreted into easily understandable power quality properties of the supply. Values are sampled and averaged over a pre-defined integration period to calculate RMS, minimum and maximum. The instrument can present the results in a number of graphical representations. For EN 50160 report, the 3D histograms and trend graphs are commonly used for evaluation of voltage changes over time. It can also include reports from other recorders, e.g. transient.
Power properties are calculated and presented in great detail. Active power is aggregated into two quantities: import or consumed power, designated a plus sign, and export or generated power, designated a minus sign. Non-active power is aggregated into four parts: positive inductive, positive capacitive, negative inductive and negative capacitive. This is also true for power factor. Energy is closely connected to power and expressed in
a similar manner. If necessary, a graphical presentation can be generated.
IEEE 519-2014 is another measuring and reporting standard, more closely directed to harmonic content. It recommends limits on harmonics and interharmonics. A general recorder is used with monitoring window of 7 days, with 3-second interval every 10 minutes. Voltage and current harmonics can be saved. Interharmonics are becoming a bigger problem with time, as more equipment that both generates them and is sensitive to them is added to the system. Interharmonics are any frequency components that are not an integer multiple of base frequency. They can be caused by any amplitude modulation of voltage or current, by non-periodic changes, e.g. a load in transient state, a device switching asynchronously to mains, saturation in inductive devices, capacitive oscillations, or other phenomena. Like other non-functional signals in the system, they can cause problems with heating, shortened life expectancy and higer maintenance cost. Higher harmonic content also increases the risk of resonance.
Energy and energy demand reports are produced with data from the general recorder with registration period of 15min and monitoring window of at least 7 days. It includes energy use profiling by hour, day and week, evaluation of use in different tariff, and cost evaluation. For optimization of energy use, a consumption profile can be created. It is the most graphical of reports, with the intention of helping with planning energy use by time of day. This can lower the maximum demand. It can also help with optimization of power factor if it changes during the day. It can be beneficial to check the efficiency view during recording. It contains a balance overview between phases, one of the easiest changes that help with efficient energy use and improves power quality in general.
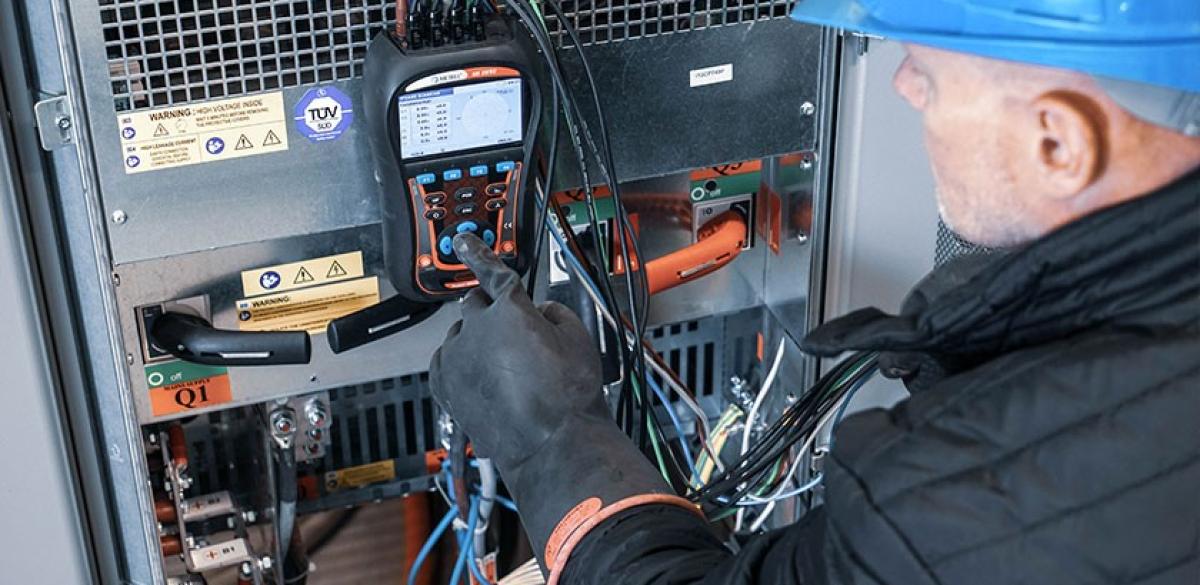
Power quality instruments can be used for troubleshooting. The integration period has to be shortened to give detailed data. Waveform and transient recorders can also be used. Waveform recording is a function in the instruments that captures actual waveform, similar to an oscilloscope. The trigger for capture has to be set with specific network or problem to solve in mind; it can be set to voltage/current level or to voltage events. An alarm can be set along with the trigger. Waveform and general recorders can run simultaneously. Transient recorder monitors voltage or current spikes that can be caused by transient effects in the grid or by errors in generation. It offers a very high sampling rate to capture the brief transient as faithfully as possible.
The third recorder and an application in itself is the inrush current recorder. It is specifically developed to monitor the current at a motor start-up.
Measurements
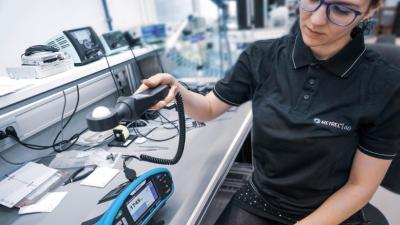
All mentioned reports are generated with Metrel PowerView 3 PC software. It can process the data in a number of ways and create graphical representations before generating a report to the chosen standard.
Downloads
| Industrial catalogues | Language | Version | Release | Notes | Type | Size | Download |
|---|---|---|---|---|---|---|---|
| Building Facilities | en | 2023 | 18.12.2023 | 38.72 MB |

|